Monitoring your website’s traffic is an important part of understanding how your visitors interact with your content. Plesk provides built-in tools that allow you to easily check your website’s traffic statistics, including data transfer usage, visitor numbers, page visits, HTTP request breakdowns, and more.
These statistics can help you analyze your website’s performance, detect unusual activity, and ensure that your hosting resources are being used efficiently.
In this tutorial, we will guide you through the process of checking your website’s traffic and data transfer statistics in Plesk.
First, ensure you are logged in to your Plesk control panel. To do that, please enter your IP address, hostname, or domain name inside your web browser’s search bar and add “:8443” at the end. It should look something like: “https://yourdomain.com:8443”. By doing that, you will be prompted by a login form requesting your username and password.

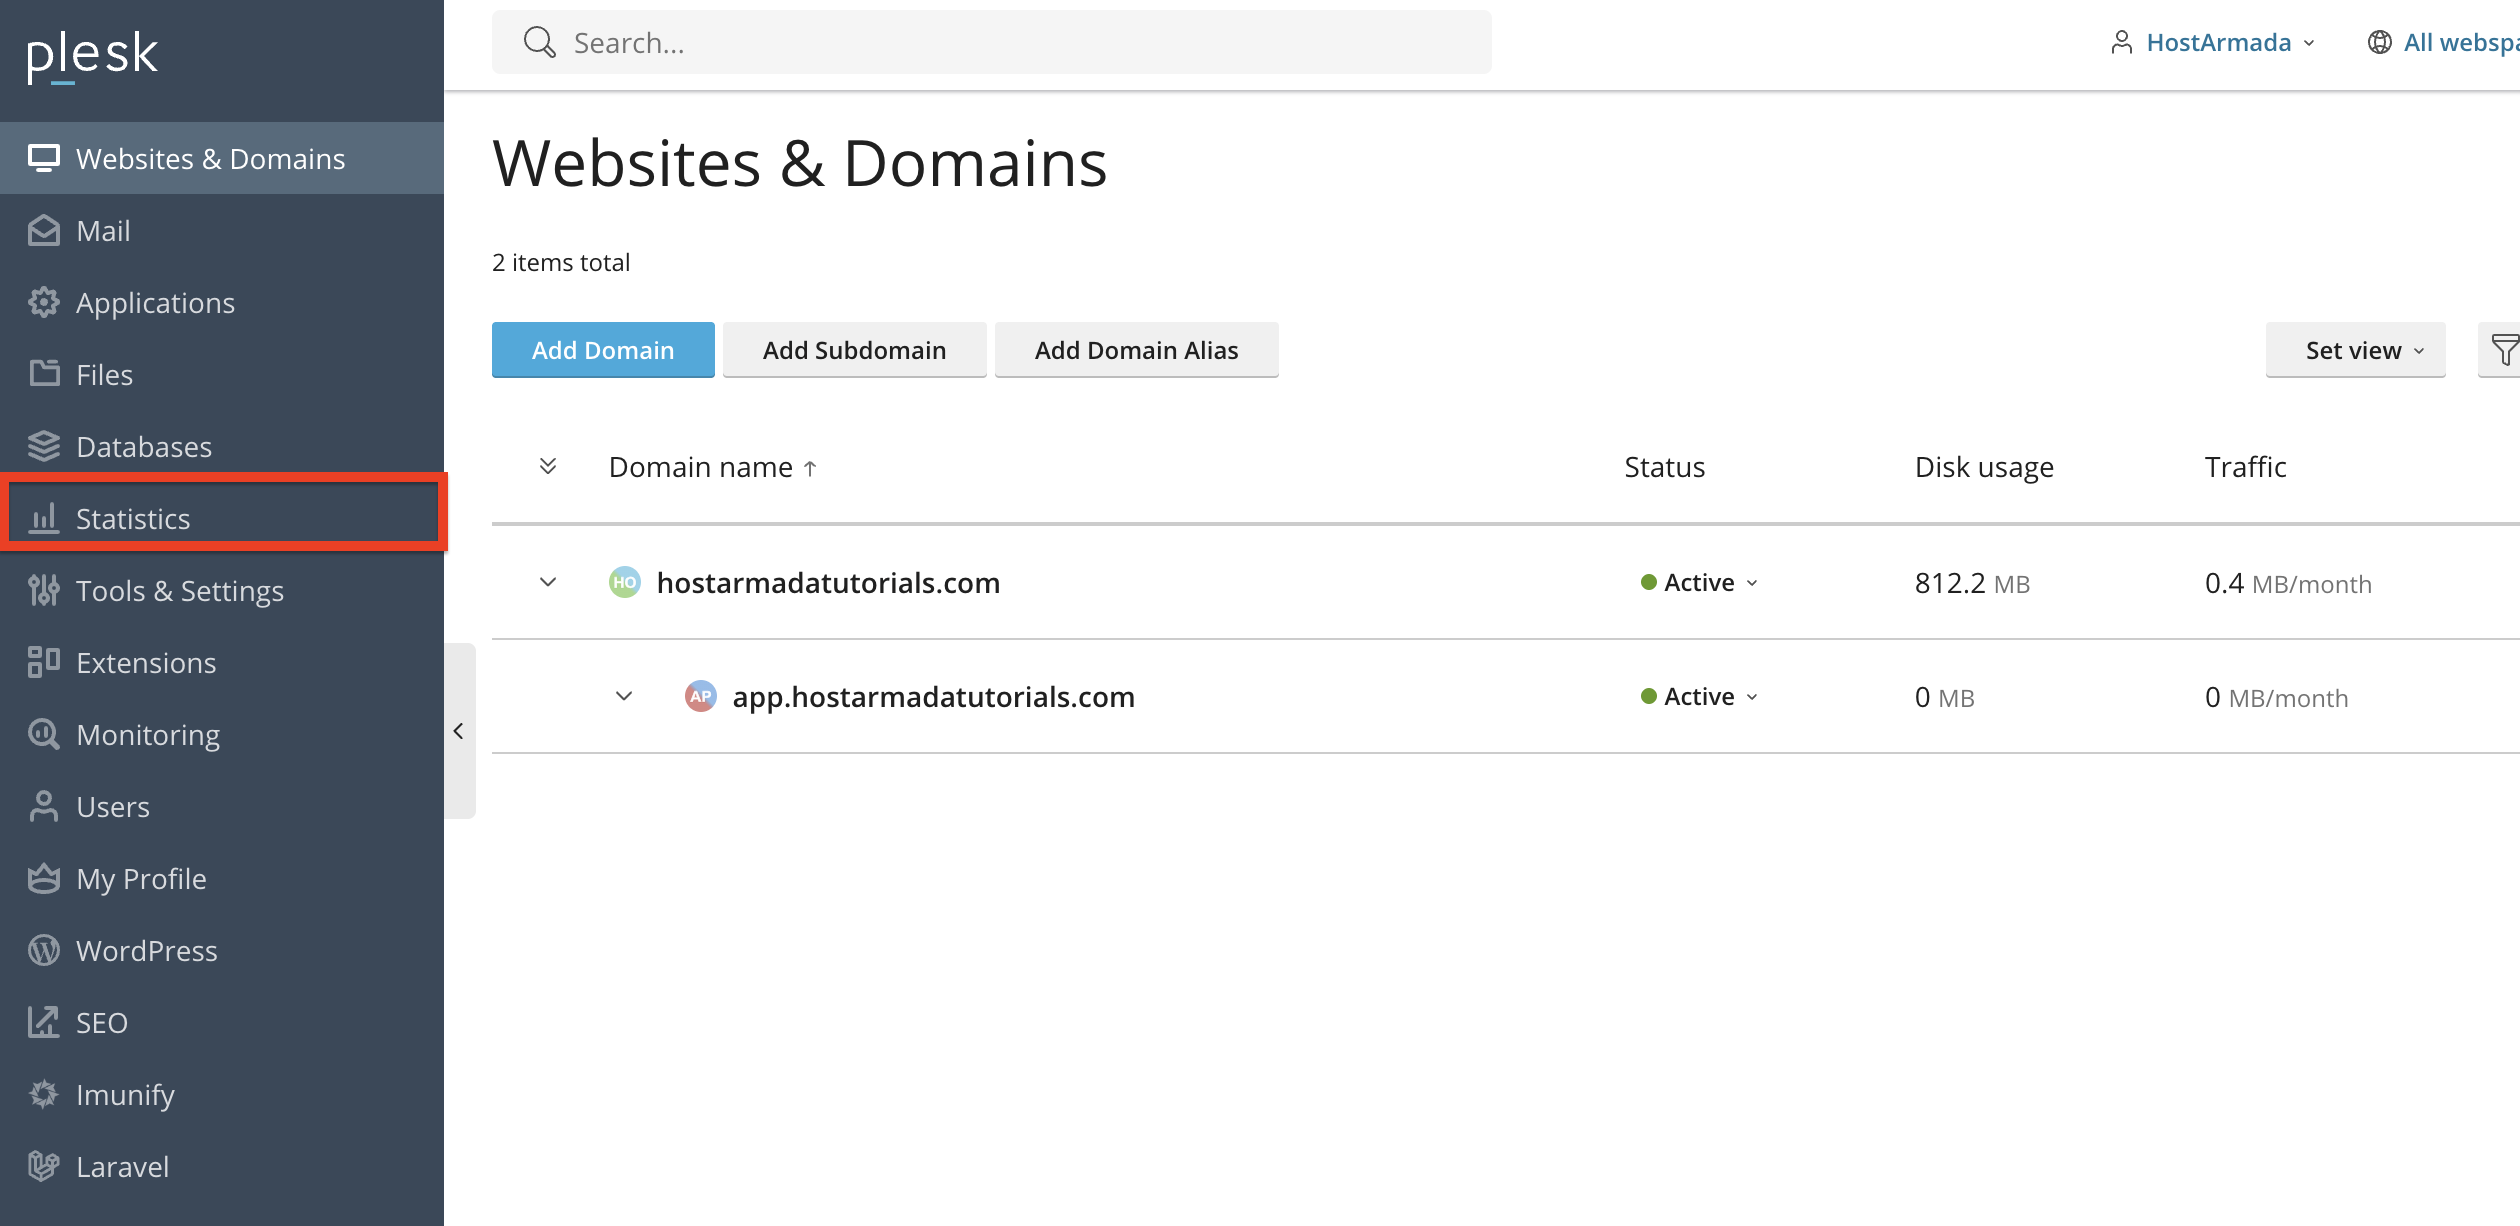
After performing the steps above, you will be redirected to the dashboard. Plesk will automatically display the “Websites & Domains” page, which will be your index page from which you can manage everything related to your websites and domains on Plesk.
To review the traffic usage for your website, click on the “Statistics” option from the left-hand menu.
Upon clicking the statistics page, you will be redirected to a page that includes both your traffic statistics and disk space usage statistics. We covered the disk space statistics in a separate tutorial!
This will open the main statistics dashboard for that particular domain.
Inside the Statistics page, you will find detailed information about your website’s data usage. This typically includes:

The breakdown will show how much data your website has transferred this month, allowing you to identify where bandwidth is being consumed.
Many Plesk installations include additional tools, such as AWStats or Webalizer, which provide graphical charts and detailed logs.
To access them, please navigate to the “Statistics” section and look for a link labeled “Web Statistics SSL/TLS”. Typically, it should be right below the pie charts. Please click on it.

This will redirect you to a page where you will see a list of all your websites. To open the AWStats panel for the desired website and view its web statistics, please click on the “View” link corresponding to the domain you want to examine.

Inside AWStats, you can see the following information:

These tools provide a more visually detailed and analytical view of your website's activity. If you want a more detailed breakdown of AWStats, you can check out the tutorial on it here.
Your Plesk traffic statistics can help you identify:
Regular monitoring helps maintain a healthy hosting environment and prevents exceeding traffic limits.
As you can see, Plesk provides clear and detailed traffic and data transfer statistics that help you understand how your website performs and how your hosting resources are being utilized. By regularly reviewing these statistics, you can enhance your website’s performance, identify potential issues early, and manage your resource usage effectively.
We hope this tutorial was helpful, and we kindly encourage you to review your traffic statistics regularly to stay informed about your website’s activity.

Nikola is an accomplished tech-savvy extraordinaire with over six years of experience in the web hosting field. He started as a customer care representative and quickly rose the ranks to become a support supervisor and, eventually - the head of the technical department in HostArmada. His deep understanding of the client's needs, combined with his technical knowledge, makes him the perfect man to create the ideal harmony between client satisfaction and professional problem-solving. You will often find him creating helpful tutorials, articles, and blog posts that help existing customers get around.
Learn more about Plesk in the other tutorials that we have:
