
As we all know, every website consists of bits of data typically represented as images, text, video, and so on the website's pages. For any Web Browser to display that data, it needs to download it first. So when a visitor accesses a website hosted on a Web Hosting server, the visitor's computing device (computer, smart device, and so on) and the Web Hosting server open a communication channel so the server can send the website's data and the user's browser can receive it. The amount of data transferred between the Web Hosting server and the visitor accessing a website on the server is called bandwidth (also referred to as Web Traffic).
A Web Hosting user can also generate bandwidth using the available FTP, SMTP, IMAP, or POP services on the server. Any file uploaded by the user will produce an equivalent amount of bandwidth. For example - if a 5MB file is uploaded, that will generate 5MB of Bandwidth.
When the Web Hosting user sends or receives a 5MB message using SMTP or IMAP/POP, the bandwidth for his Web Hosting account will increase with that same value.
The bandwidth generated on a Web Hosting account should not be mistaken for Network Bandwidth. This term is used in networking to describe the bit rate or the highest throughput in a computer network for a set amount of time. A relatable example would be the maximum download or upload speed permitted by your ISP in megabytes (or even gigabytes) per second.
This tutorial will go over the most reliable way to check the bandwidth usage for your Web Hosting account and further explain how you can read it correctly.
For our Shared Hosting packages, we do not actively monitor bandwidth usage. Therefore we will never limit a website regarding how much it can grow or charge a customer extra for generated bandwidth.
However, bandwidth is not an infinite resource, and excessive usage is something we care about because it violates the idea behind the Shared Hosting service. As our customers know, the Shared Hosting environment is much more affordable and easy to use than a more dedicated Solution such as a Cloud VPS service. That is how all the physical resources of the Shared Hosting Server are distributed amongst all the customers hosted on the same.
Or in other words, all the customers must use a fair and equal share from the resource of the Web Hosting server. So if the Bandwidth usage of a single web hosting account is increased, this typically means that the consumption of RAM, CPU, and I/O are increased, which violates the fair distribution of resources.
Not every website is equal. Some websites are generating more bandwidth than others, for example, on a single visit. Therefore the Bandwidth usage cannot be related to the number of visits a website gets. The bigger the size of the pages, the more bandwidth will be generated when the website is visited.
To provide our customers with an insight into the optimal Bandwidth usage for any website, we have actively monitored each of our Web Hosting servers for a prolonged time. The result is compiled in the following table representing the “Optimal Usage” that a web hosting account can generate without any risks for the performance.
| Shared Hosting Plan | Optimal Usage |
| Start Dock | 3245 MB |
| Web Warp | 6384 MB |
| Speed Reaper | 9153 MB |
Of course, the optimal values are by no means the values that a client's hosting account can handle. We conducted further research and estimated the “Acceptable Usage” a HostArmada user's hosting account can support before this caused degraded performance for both the user and the rest of the clients hosted on that server:
| Shared Hosting Plan | Acceptable Usage |
| Start Dock | 32534 MB |
| Web Warp | 63875 MB |
| Speed Reaper | 91539 MB |
For all websites generating that much Bandwidth, we can surely say that our shared hosting services are not designed to accommodate such resource-demanding websites. Because of that, we created other Web Hosting plans to fulfill this role and give clients a suitable solution for their projects. Our team is more than ready to accurately suggest the best possible Web Hosting plan for your website’s needs should you need help with that. They are reachable 24/7 over our live chat and ticketing systems.
Please note that we will never take action towards a customer's Web Hosting account immediately when we detect a Bandwidth overuse. Our team of trained professionals will always try to contact our customers and help them solve this problem by any means possible from our end.
The most reliable source of information about bandwidth generation is undoubtedly the cPanel service. It has various tools at our customers’ disposal that offer detailed reports on how their websites/services generated bandwidth. We have a fantastic tutorial about the "Bandwidth" functionality inside the cPanel, which you should check here.
The other useful functionality in the cPanel we will look into is "Awstats". To access it, our customers should access the cPanel service of their web hosting accounts. Once located in cPanel, please search for the “Awstats” feature using the search functionality at the top of the page.
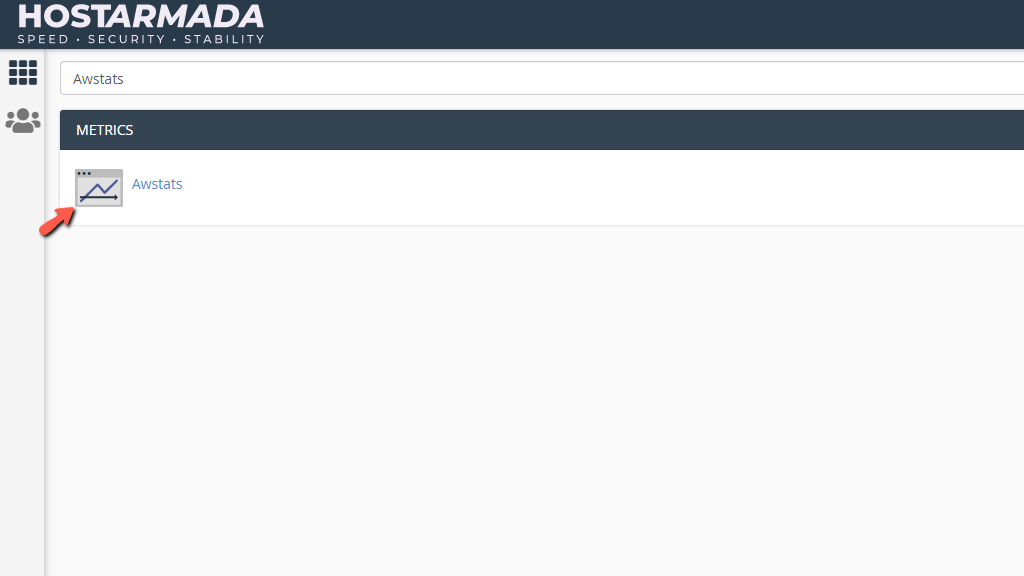
When the “Awstats” feature appears beneath the search bar, please click on it.
Doing so will take you to a page where you can see all your sites in a table view. To preview the Awstats statistics for a website, please click on the "View" button located under the "Actions" column for the respective site you want to check the bandwidth usage for.

You will see both SSL and Non-SSL versions. If you host your site on HostArmada, please be sure to select the SSL version as we have routed all HTTP traffic to HTTPS to ensure our clients’ websites are always secure in the web browser.
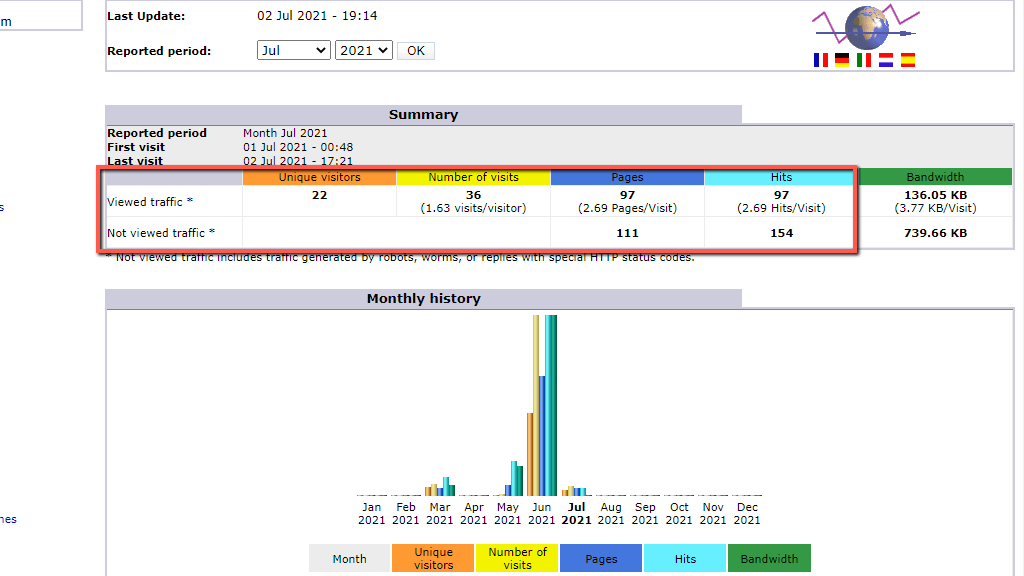
Now that you have entered the actual "Awstats" dashboard on the top right side, you will see the total amount of bandwidth generated by your site for this particular month.
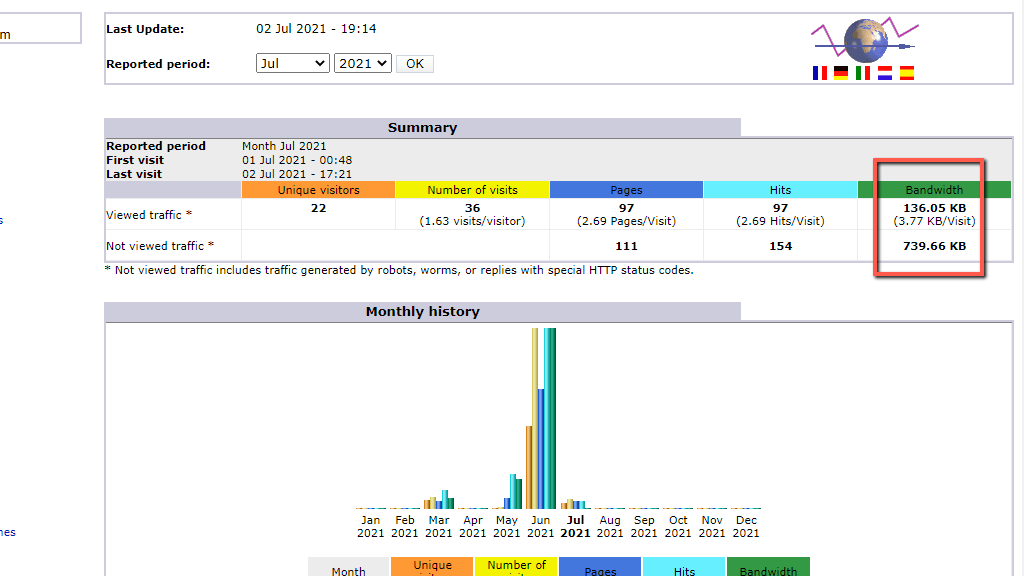
As you may have noticed, there are two rows. The first one represents the total "human" traffic. This row shows how much bandwidth was generated by actual human beings accessing your website via web browsers. The second one represents the "non-human" traffic. This is the traffic generated by various bots and crawlers.
Let's go over the Summary table and what all the columns inside mean:
Now that we have explained the traffic summary let's delve deeper and explain the rest of the statistics at your disposal.
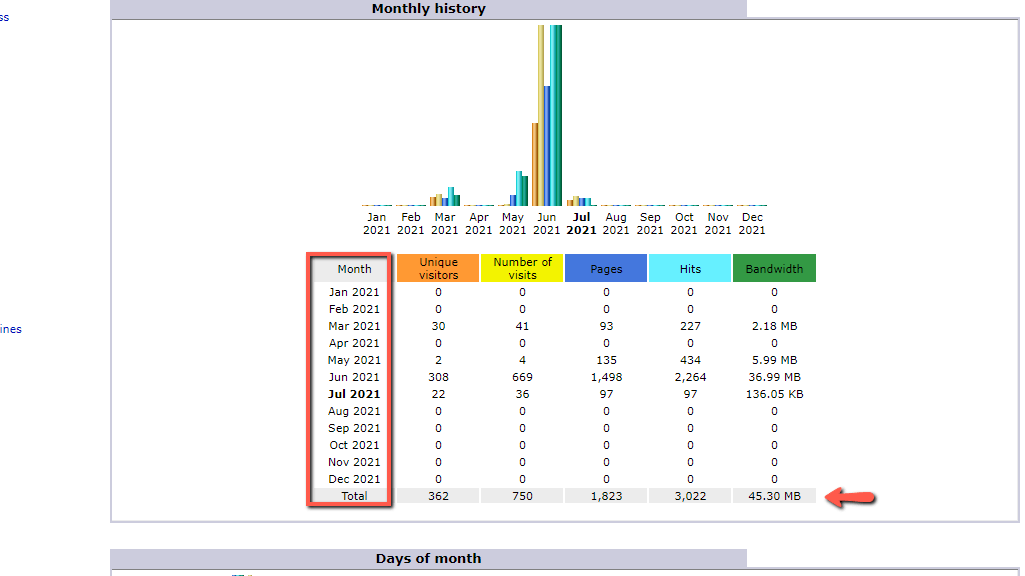
Underneath the "Summary" table, you can find the "Monthly History" table. Inside it, you can see reports on all the Unique Visits, Numbers of Visits, Pages, Hits, and Bandwidth from previous months. At the bottom row, you can even see the total traffic generated by the website for all months combined.
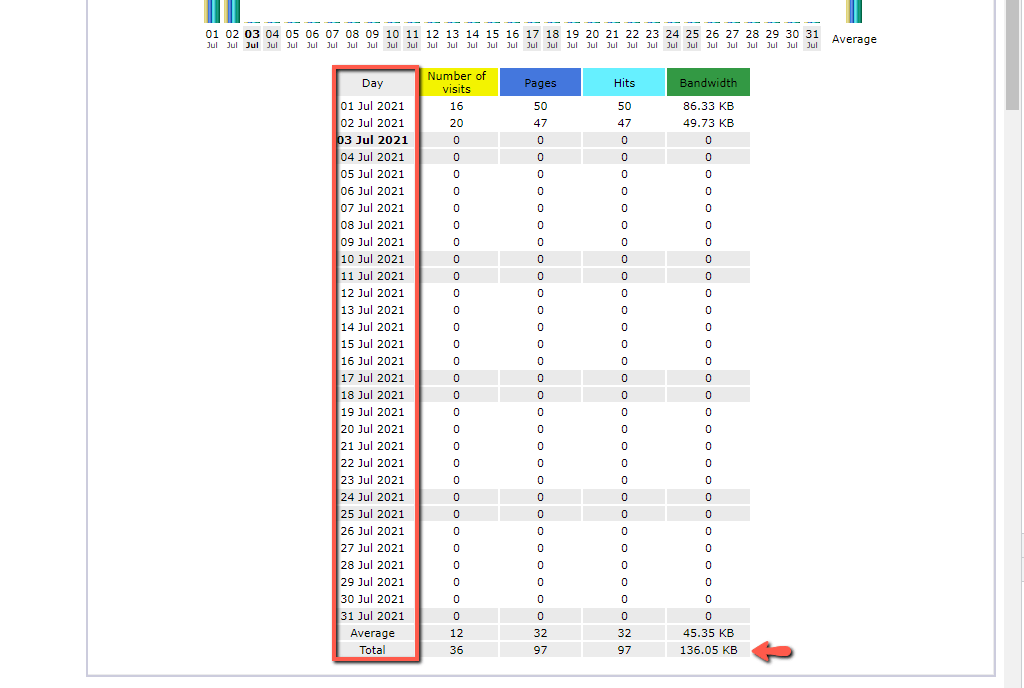
Below the "Monthly History" table, you can find the "Days of month" table section. Inside, you will see the bandwidth your website generates each day. In addition to the total visits, hits, page visits, and bandwidth, you will see an average value on the bottom row.
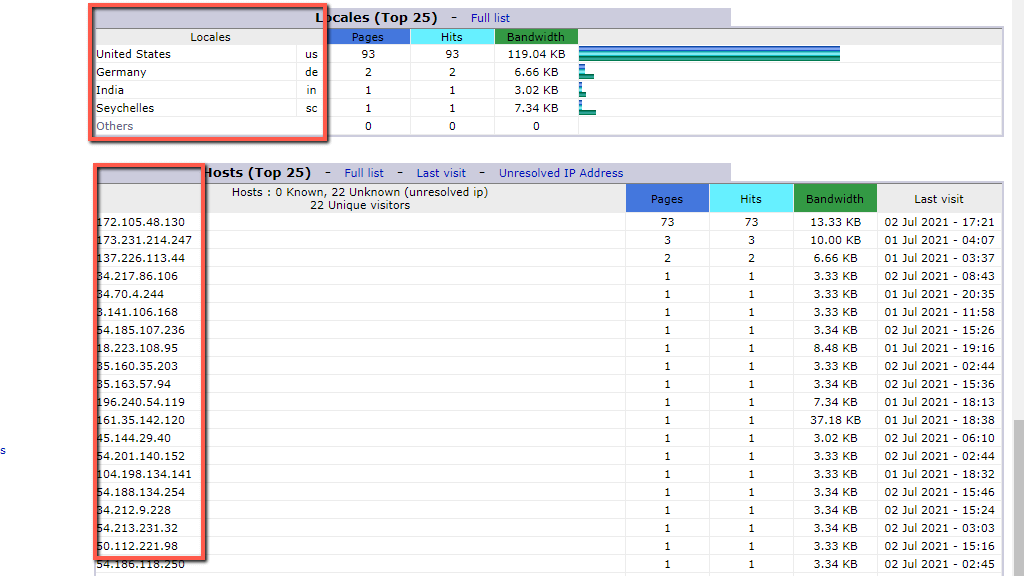
Going down even further, you will see the "Locales" and "Hosts" table sections. Inside, you will find information about which countries and IP addresses visited the website the most.
Last but not least are the "Robots/Spiders", "Visits duration", and "File Type" charts.
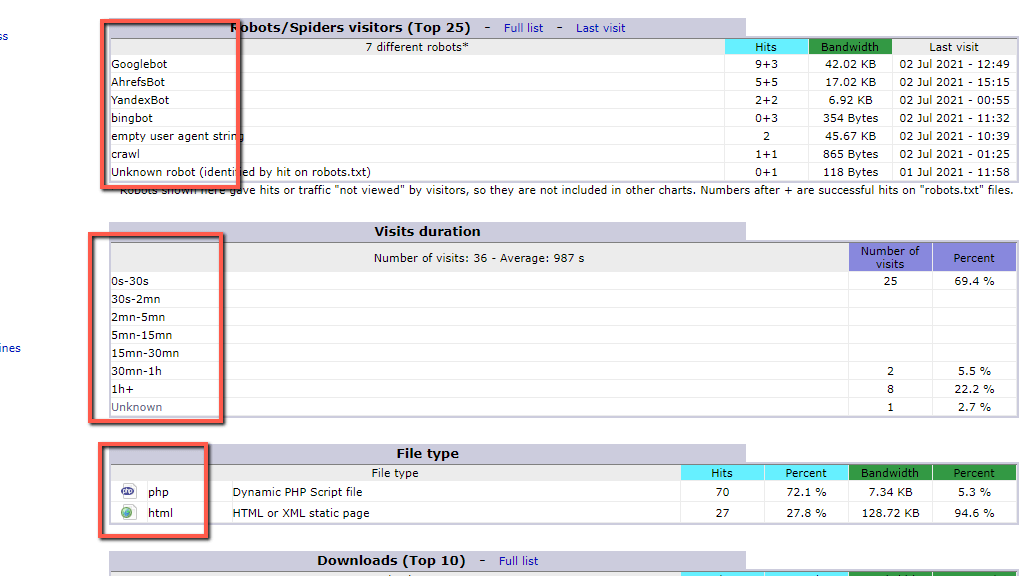
The first chart will show you information about the user agents (bots and crawlers) that visited the site. This info is pretty essential, as you may have lots of "non-human" traffic, and this can give you an idea of which user agent generated is responsible.
The second chart will show you how much time your audience spent on the site.
The last chart will show you the most accessed file types on the website. Knowing this information can help you perform optimizations on this specific file and reduce the bandwidth it generates.
We will not go over the rest of the chats inside the “Awstats” functionality as they do not contain relevant information and are used in sporadic and specific cases. The data from the charts we went over is sufficient enough to evaluate your bandwidth correctly.
We hope that you found the provided information helpful. We hope that you will pinpoint the "bad" traffic and eliminate it with the acquired knowledge. Maintaining a healthy bandwidth value each month is essential and will make your Web Hosting experience much smoother. Be sure to check our other tutorial, which goes over the best practices you can use to optimize your hosting account's bandwidth usage.

Nikola is an accomplished tech-savvy extraordinaire with over six years of experience in the web hosting field. He started as a customer care representative and quickly rose the ranks to become a support supervisor and, eventually - the head of the technical department in HostArmada. His deep understanding of the client's needs, combined with his technical knowledge, makes him the perfect man to create the ideal harmony between client satisfaction and professional problem-solving. You will often find him creating helpful tutorials, articles, and blog posts that help existing customers get around.
Learn more about Resource Usage in the other tutorials that we have:
